Difference between revisions of "WHO Integrated Data Platform (WIDP)"
| Line 1: | Line 1: | ||
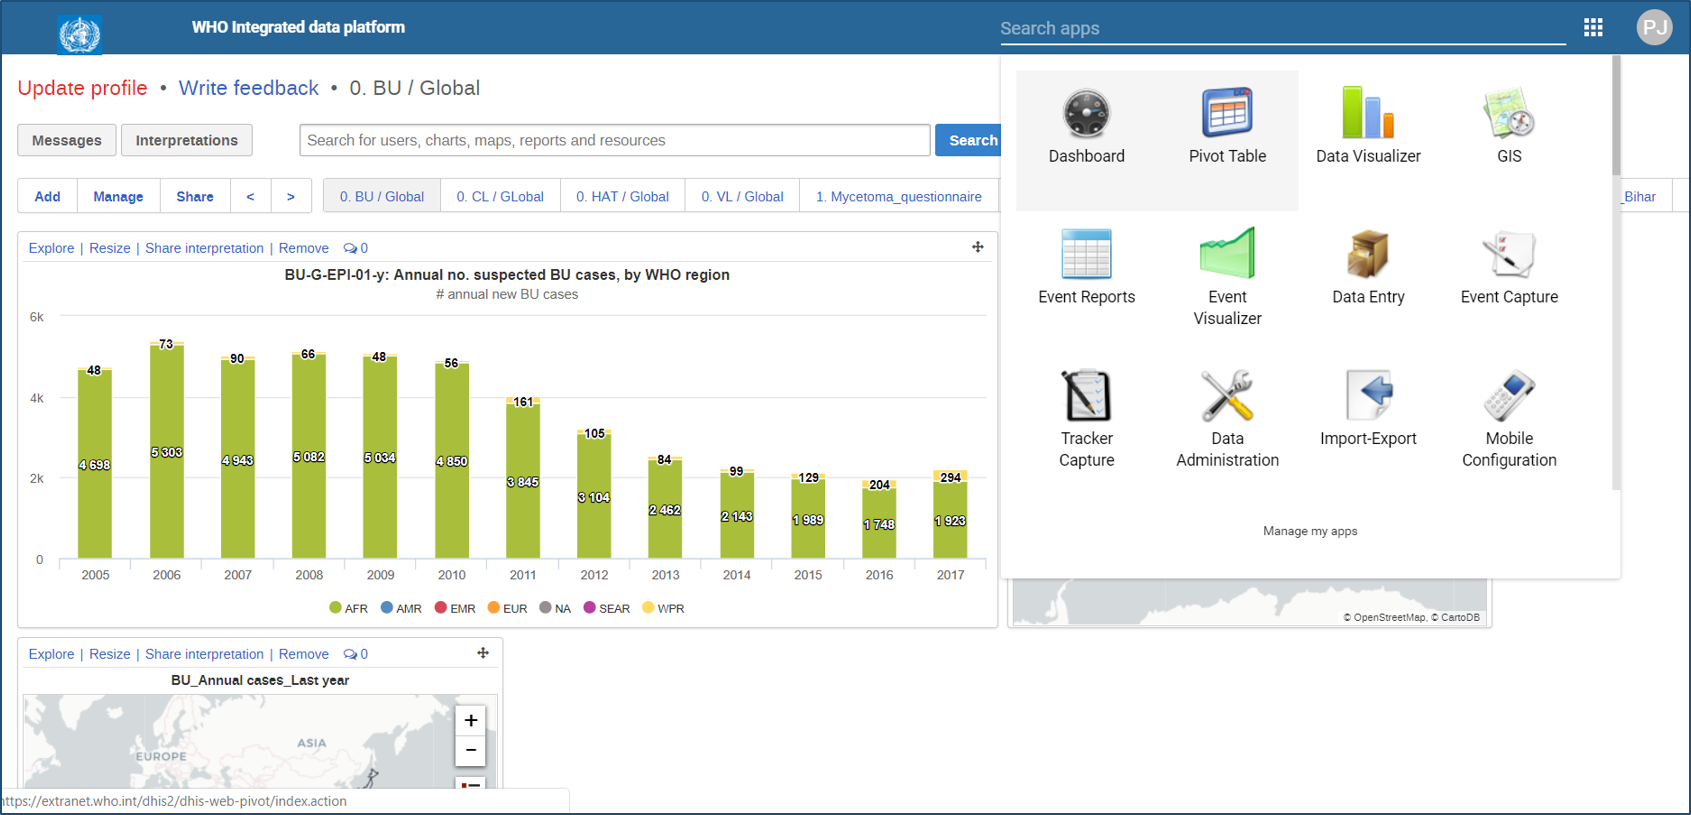
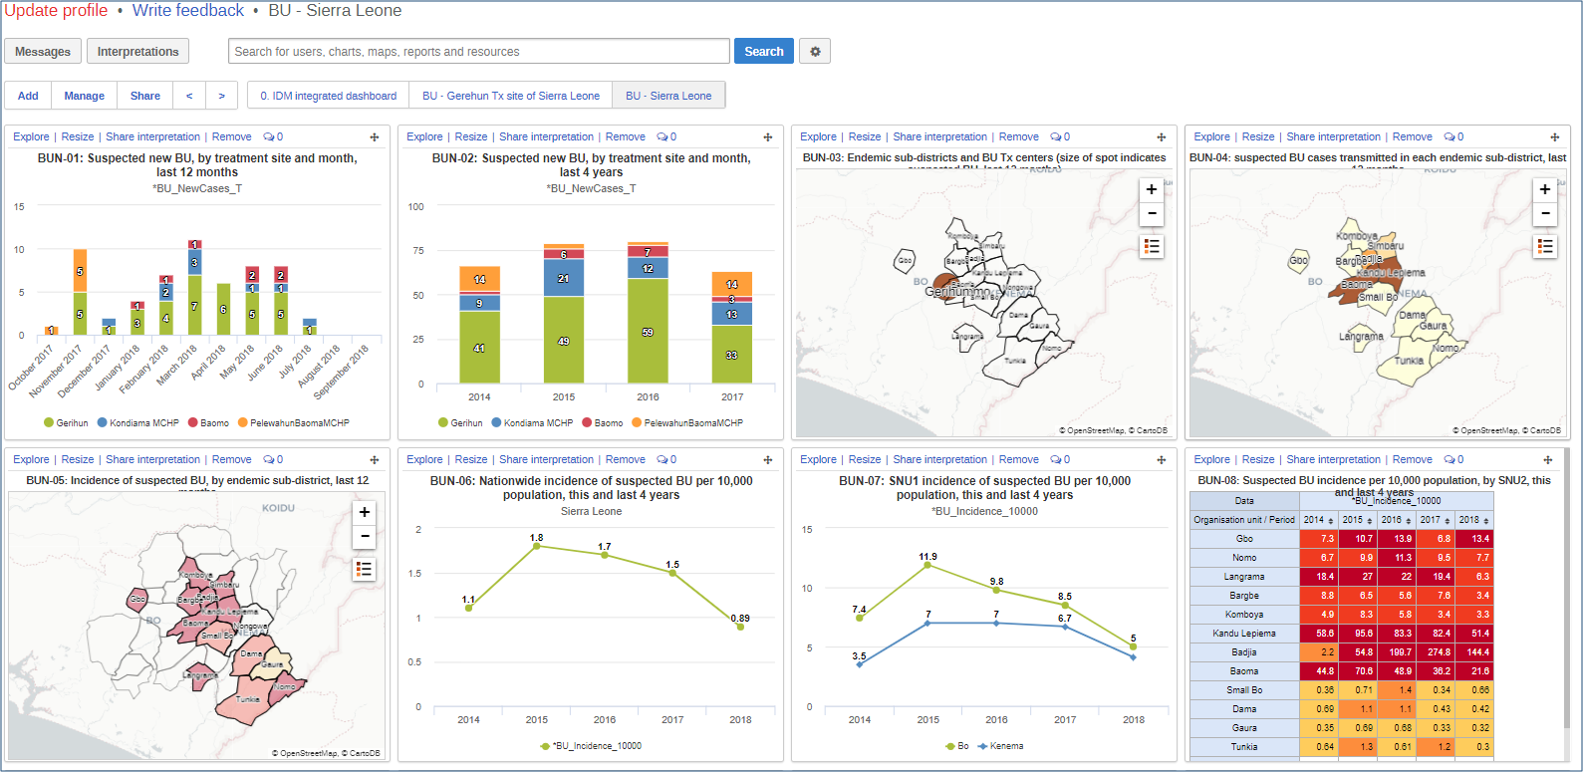
[[File:Widp-main.png|700px|right|thumb|WHO Integrated Data Platform (WIDP)]] | [[File:Widp-main.png|700px|right|thumb|WHO Integrated Data Platform (WIDP)]] | ||
| − | [[File:Widp.png|left| | + | [[File:Widp.png|left|110px]]WHO Integrated Data Platform (WIDP) is a graphical web-based health management information system (HMIS) used at WHO for regular data reporting, as well as for empowering countries for local routine surveillance and monitoring. WIDP is built on top of [https://www.dhis2.org/ District Health Information Software 2 (DHIS2)], an open source, web-based HMIS platform, already in use by Ministries of Health, research centers, NGOs and other parties in more than 100 countries around the world. WIDP supports data collection as well as data analysis and visualization. |
Latest revision as of 11:13, 31 October 2018
WHO Integrated Data Platform (WIDP) is a graphical web-based health management information system (HMIS) used at WHO for regular data reporting, as well as for empowering countries for local routine surveillance and monitoring. WIDP is built on top of District Health Information Software 2 (DHIS2), an open source, web-based HMIS platform, already in use by Ministries of Health, research centers, NGOs and other parties in more than 100 countries around the world. WIDP supports data collection as well as data analysis and visualization.
Contents
WIDP Data model
The most important feature of WIDP is the data model it uses for capturing data.
WIDP distinguishes two main types of data:
- Individual: Data about individual cases or events, occurred in a specific point in time. Respectively, these data can be identifiable (Trackers, e.g., patient records) or non-identifiable (Events, e.g., Dwelling inspections/interventions).
- Aggregated (Collective): Data summarized over a specified period of time (daily, weekly, monthly, quarterly, yearly, etc.) and for a specific geographical area.
Data inside WIDP can be collected and analyzed through various dimensions.
- What? - main information of interest (e.g., Number of infection cases, Result of serological diagnosis). DHIS2 implements it through data elements.
- Where? - geographical location to which the information relates to (e.g., Region/City of infection cases, Health facility where the serological diagnosis is done). DHIS2 implements it through organisation unit hierarchy.
- When? - Date or period to which the information relates to (e.g., Period for which the infection cases are calculated, Date of the serological tests). DHIS2 implements it through different types of periods.
- Other customizable set of dimensions (e.g., pharmaceutical companies dispatching the medicine). DHIS2 implements them through attribute categories.
Data entry in WIDP
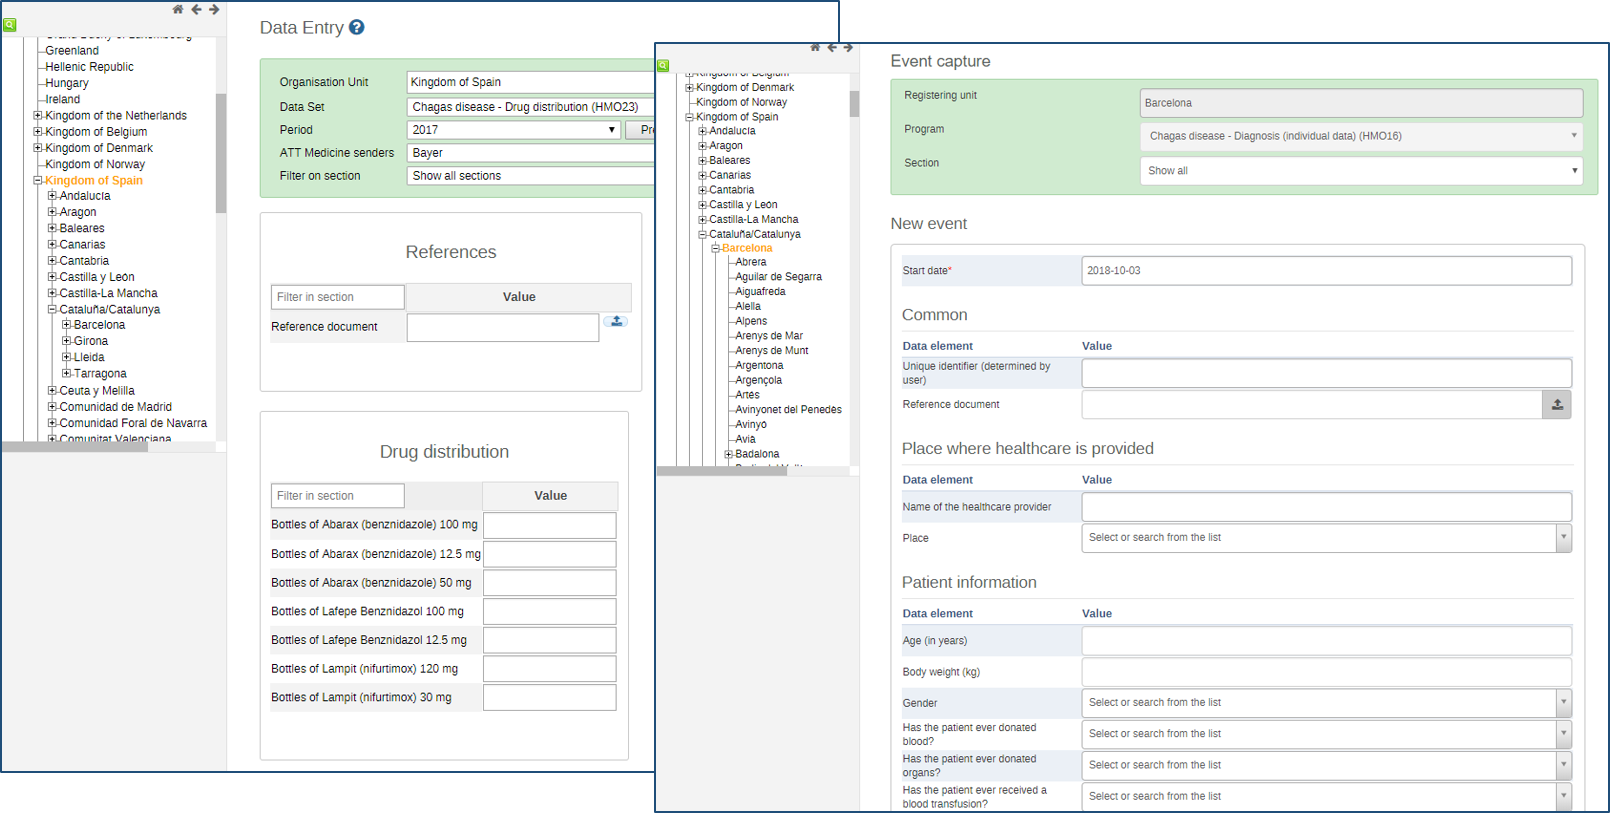
Depending on the type of data, WIDP offers three core apps for form-based data entry:
- Aggregated data: Data Entry
- Individual non-identifiable data:Event Capture
- Individual identifiable data: Tracker Capture
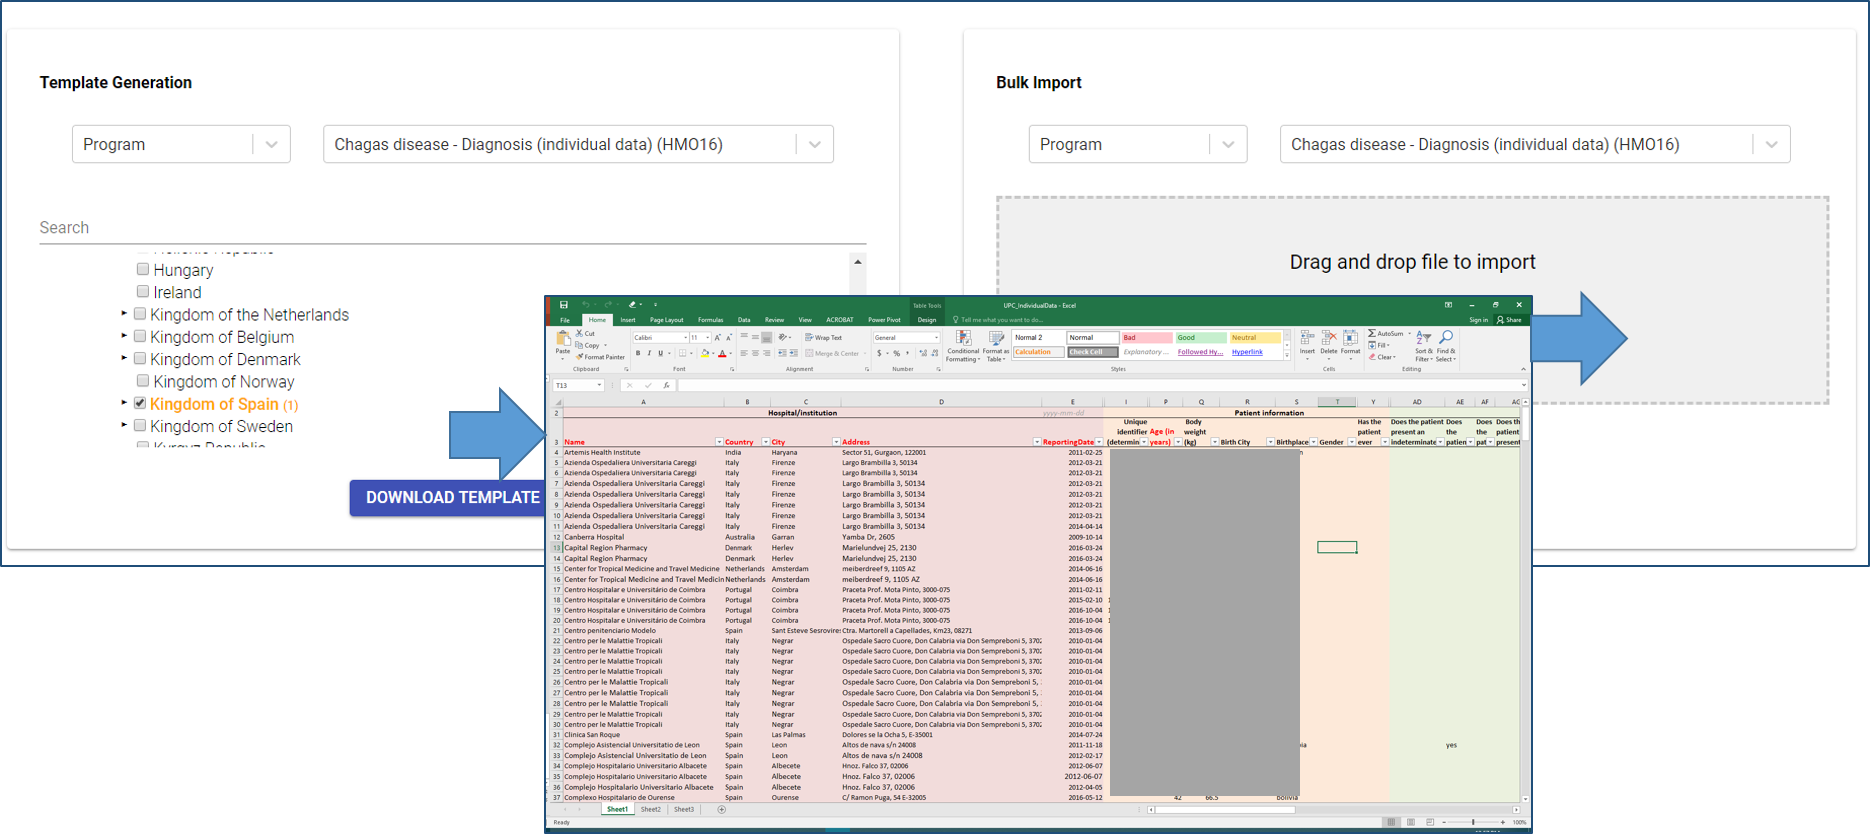
In addition, WIDP also allows you to enter data in a massive (bulk) mode using Excel spreadsheets though Bulk load app.
Data analysis and visualization in WIDP
Starting from data entered into the system, WIDP also allows automatic calculation of indicators by combining information from one or more data collection forms, and their constant monitoring through dashboards.
WIDP provides support for analyzing and visualizing previously collected data inside dashboards, namely through three main data visualization elements:
To help more collaborative analysis of data DHIS2 allows entering textual interpretations of dashboard elements, comments and discussions. See more information about managing dashboards in WIDP.
WIDP in use
WIDP in use for Neglected Tropical Diseases
